Airthings View Plus Review
Indoor air quality has seen a lot more attention paid to it since a certain event in 2020 happened, especially for those of us spending more time at home. Whether you're working remotely, caring for young children, or managing allergies, the air you breathe directly impacts your health and productivity. The Airthings View Plus gives us a transparent way to monitor something in all our homes that we can’t see, offering real-time insights into pollutants, allergens and CO2 levels — all in what is marketed as an easy-to-use, smart package. But does it offer accuracy and does understanding our air quality lead us to healthier, more breathable indoor spaces? Let’s find out.
Design
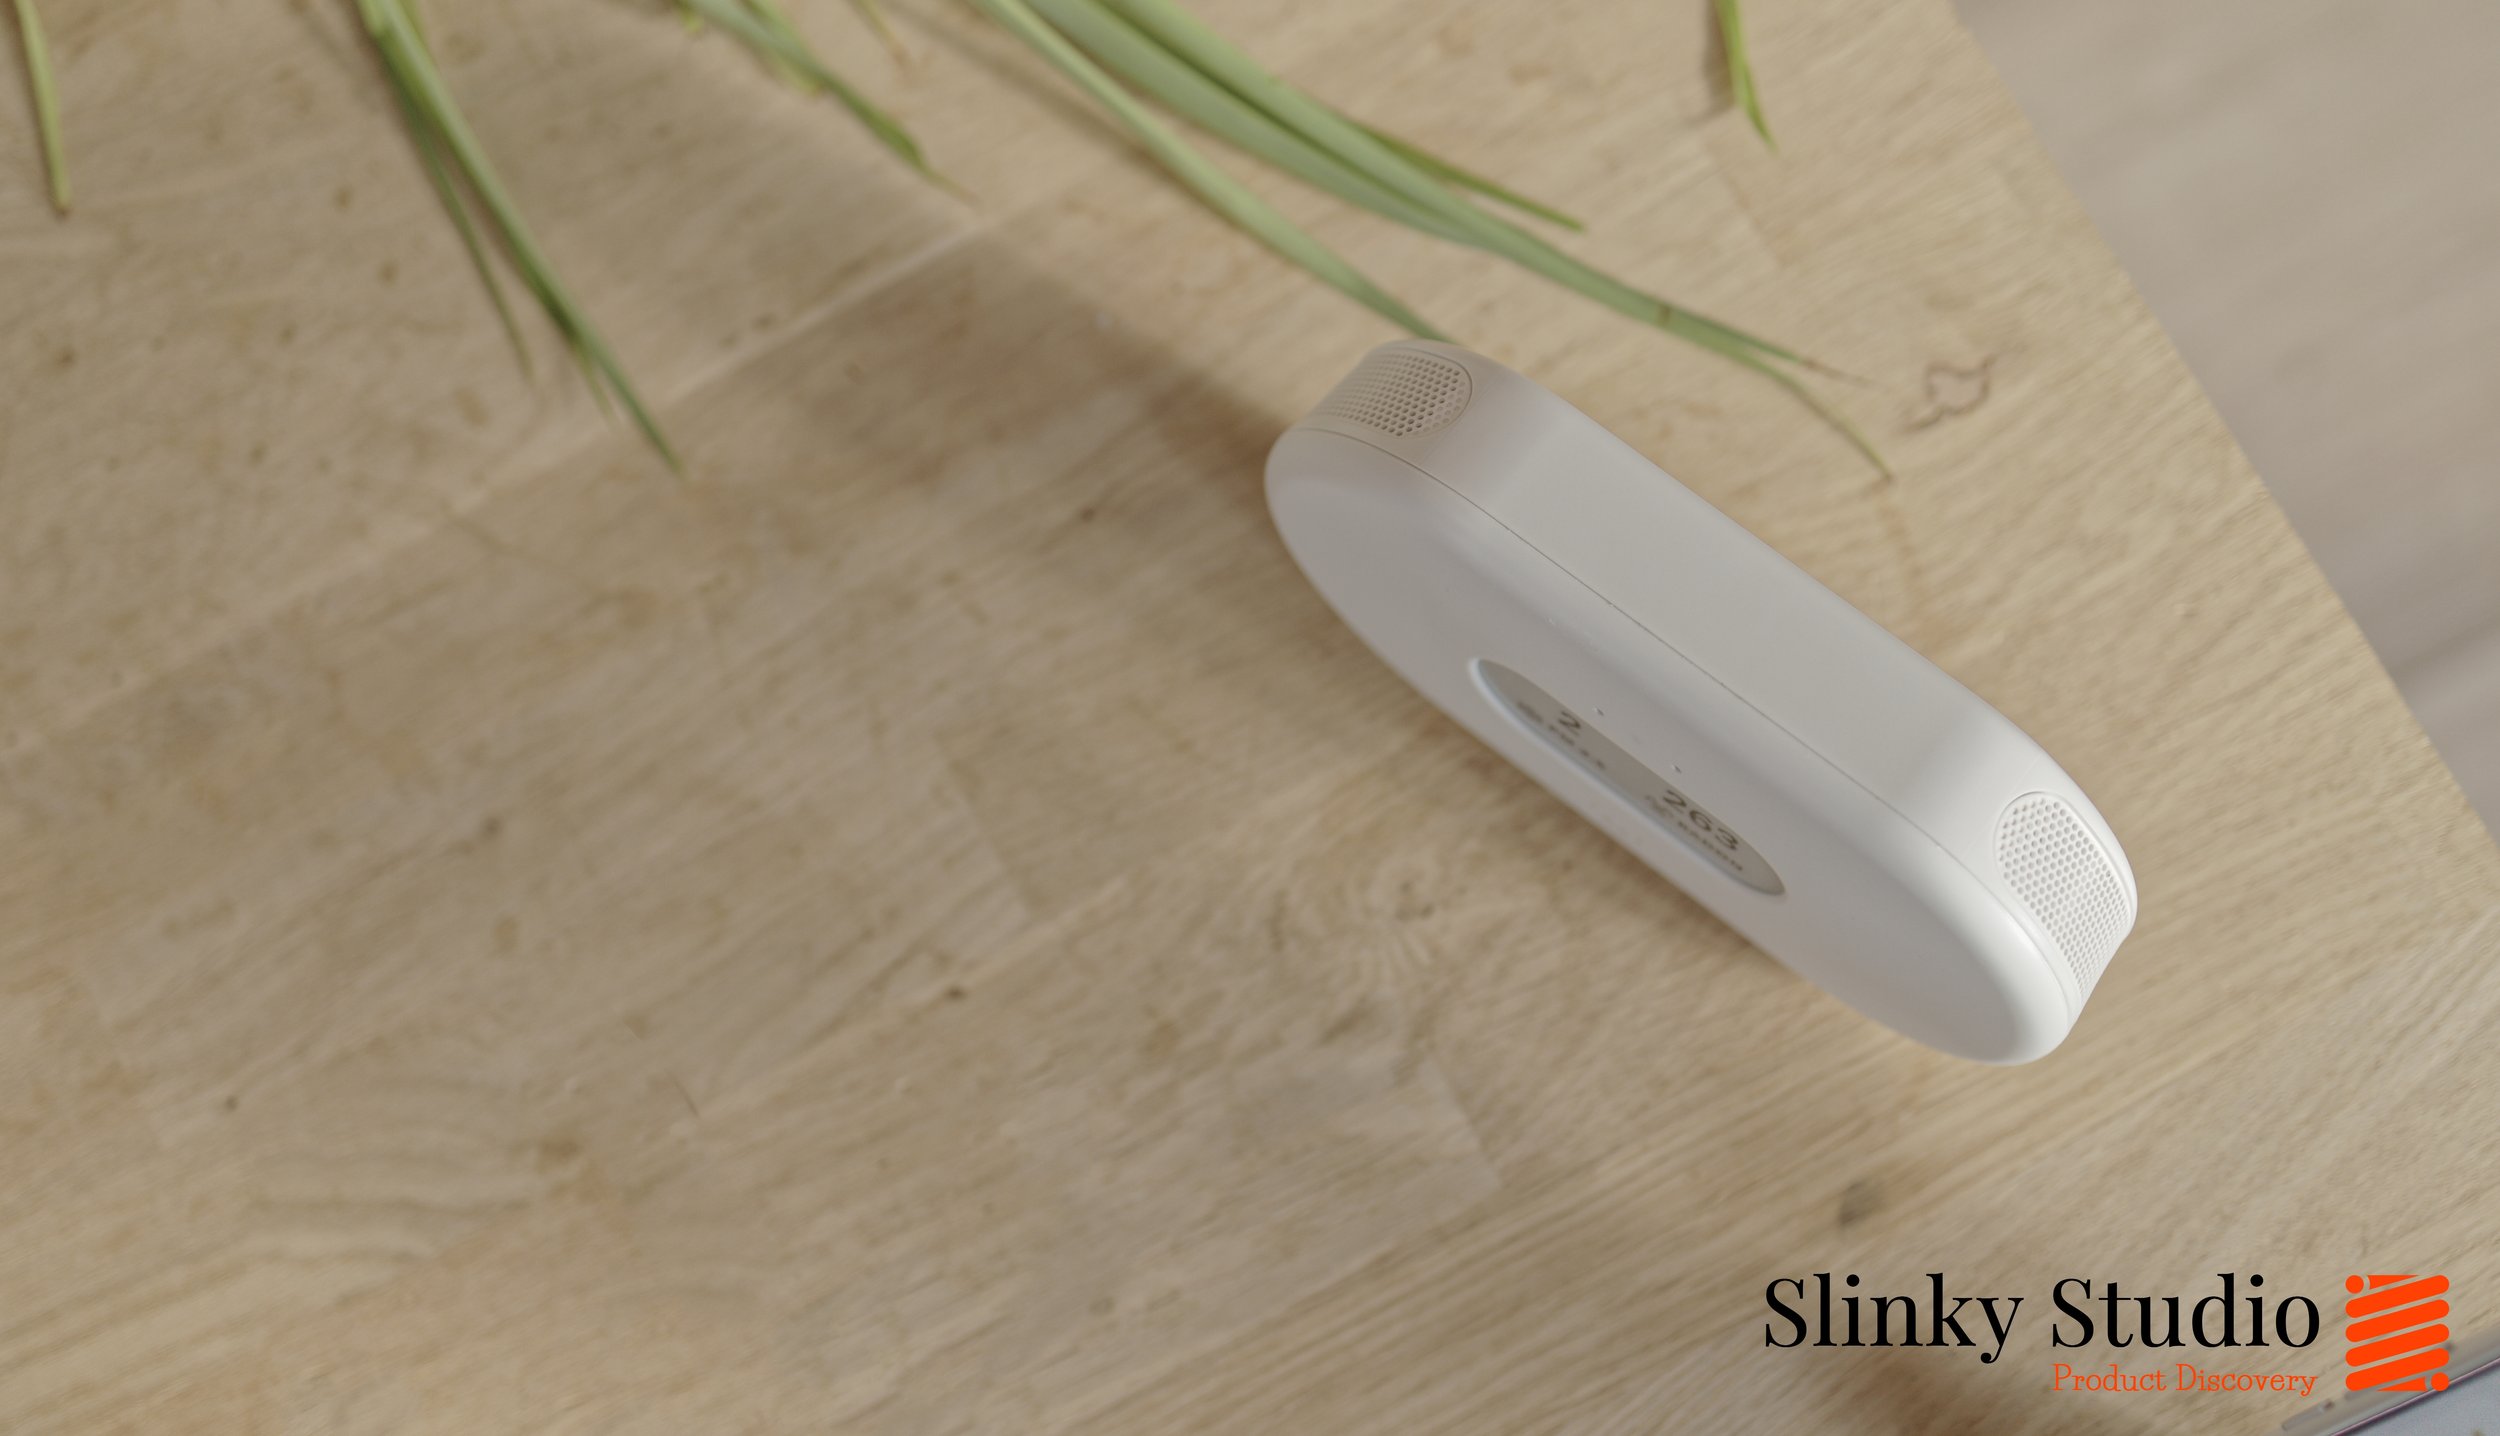
The Airthings View Plus is an easy addition to any home or workspace. With its smooth, rounded edges and matte white finish, the device has a minimalist aesthetic that blends seamlessly with modern interiors. Its compact size ensures it doesn’t dominate the space, whether placed on a desk, shelf, or wall-mounted using the included hardware.
One of the standout features is the e-ink display, which is both power-efficient and easy on the eyes. The screen is crisp and readable from various angles, displaying key air quality metrics at a glance. The display’s adaptability allows users to customise what’s shown as their "priority" view, such as PM2.5 levels, radon, CO2, or temperature, depending on their concerns. With a simple wave of your hand, which always works and is a bit of a throwback to the Auluxe Wave E3 speaker that features similar tech to control audio, the device lights up red, amber or green to reveal whether each of your chosen air quality metrics is good or not — so there’s no need to press buttons or check your phone for an at-a-glance idea of air quality.
Additionally, the View Plus features a USB-C port for power, though it can also run on batteries, which is how we use it, for complete portability. Airthings claim the six AA batteries last for up to 2 years, and from our six weeks of usage, the battery has diminished by 4-5%, so the estimated battery range sounds about right.

Setup & the App
A neat part of the Airthings View Plus design is that it connects to your home Wi-Fi, so the air quality can be monitored through the app from anywhere in the world. In our case, we had it within an external building for a week or so to get an idea of radon levels around our property, and it was nice to be able to check-in on this wherever we were.
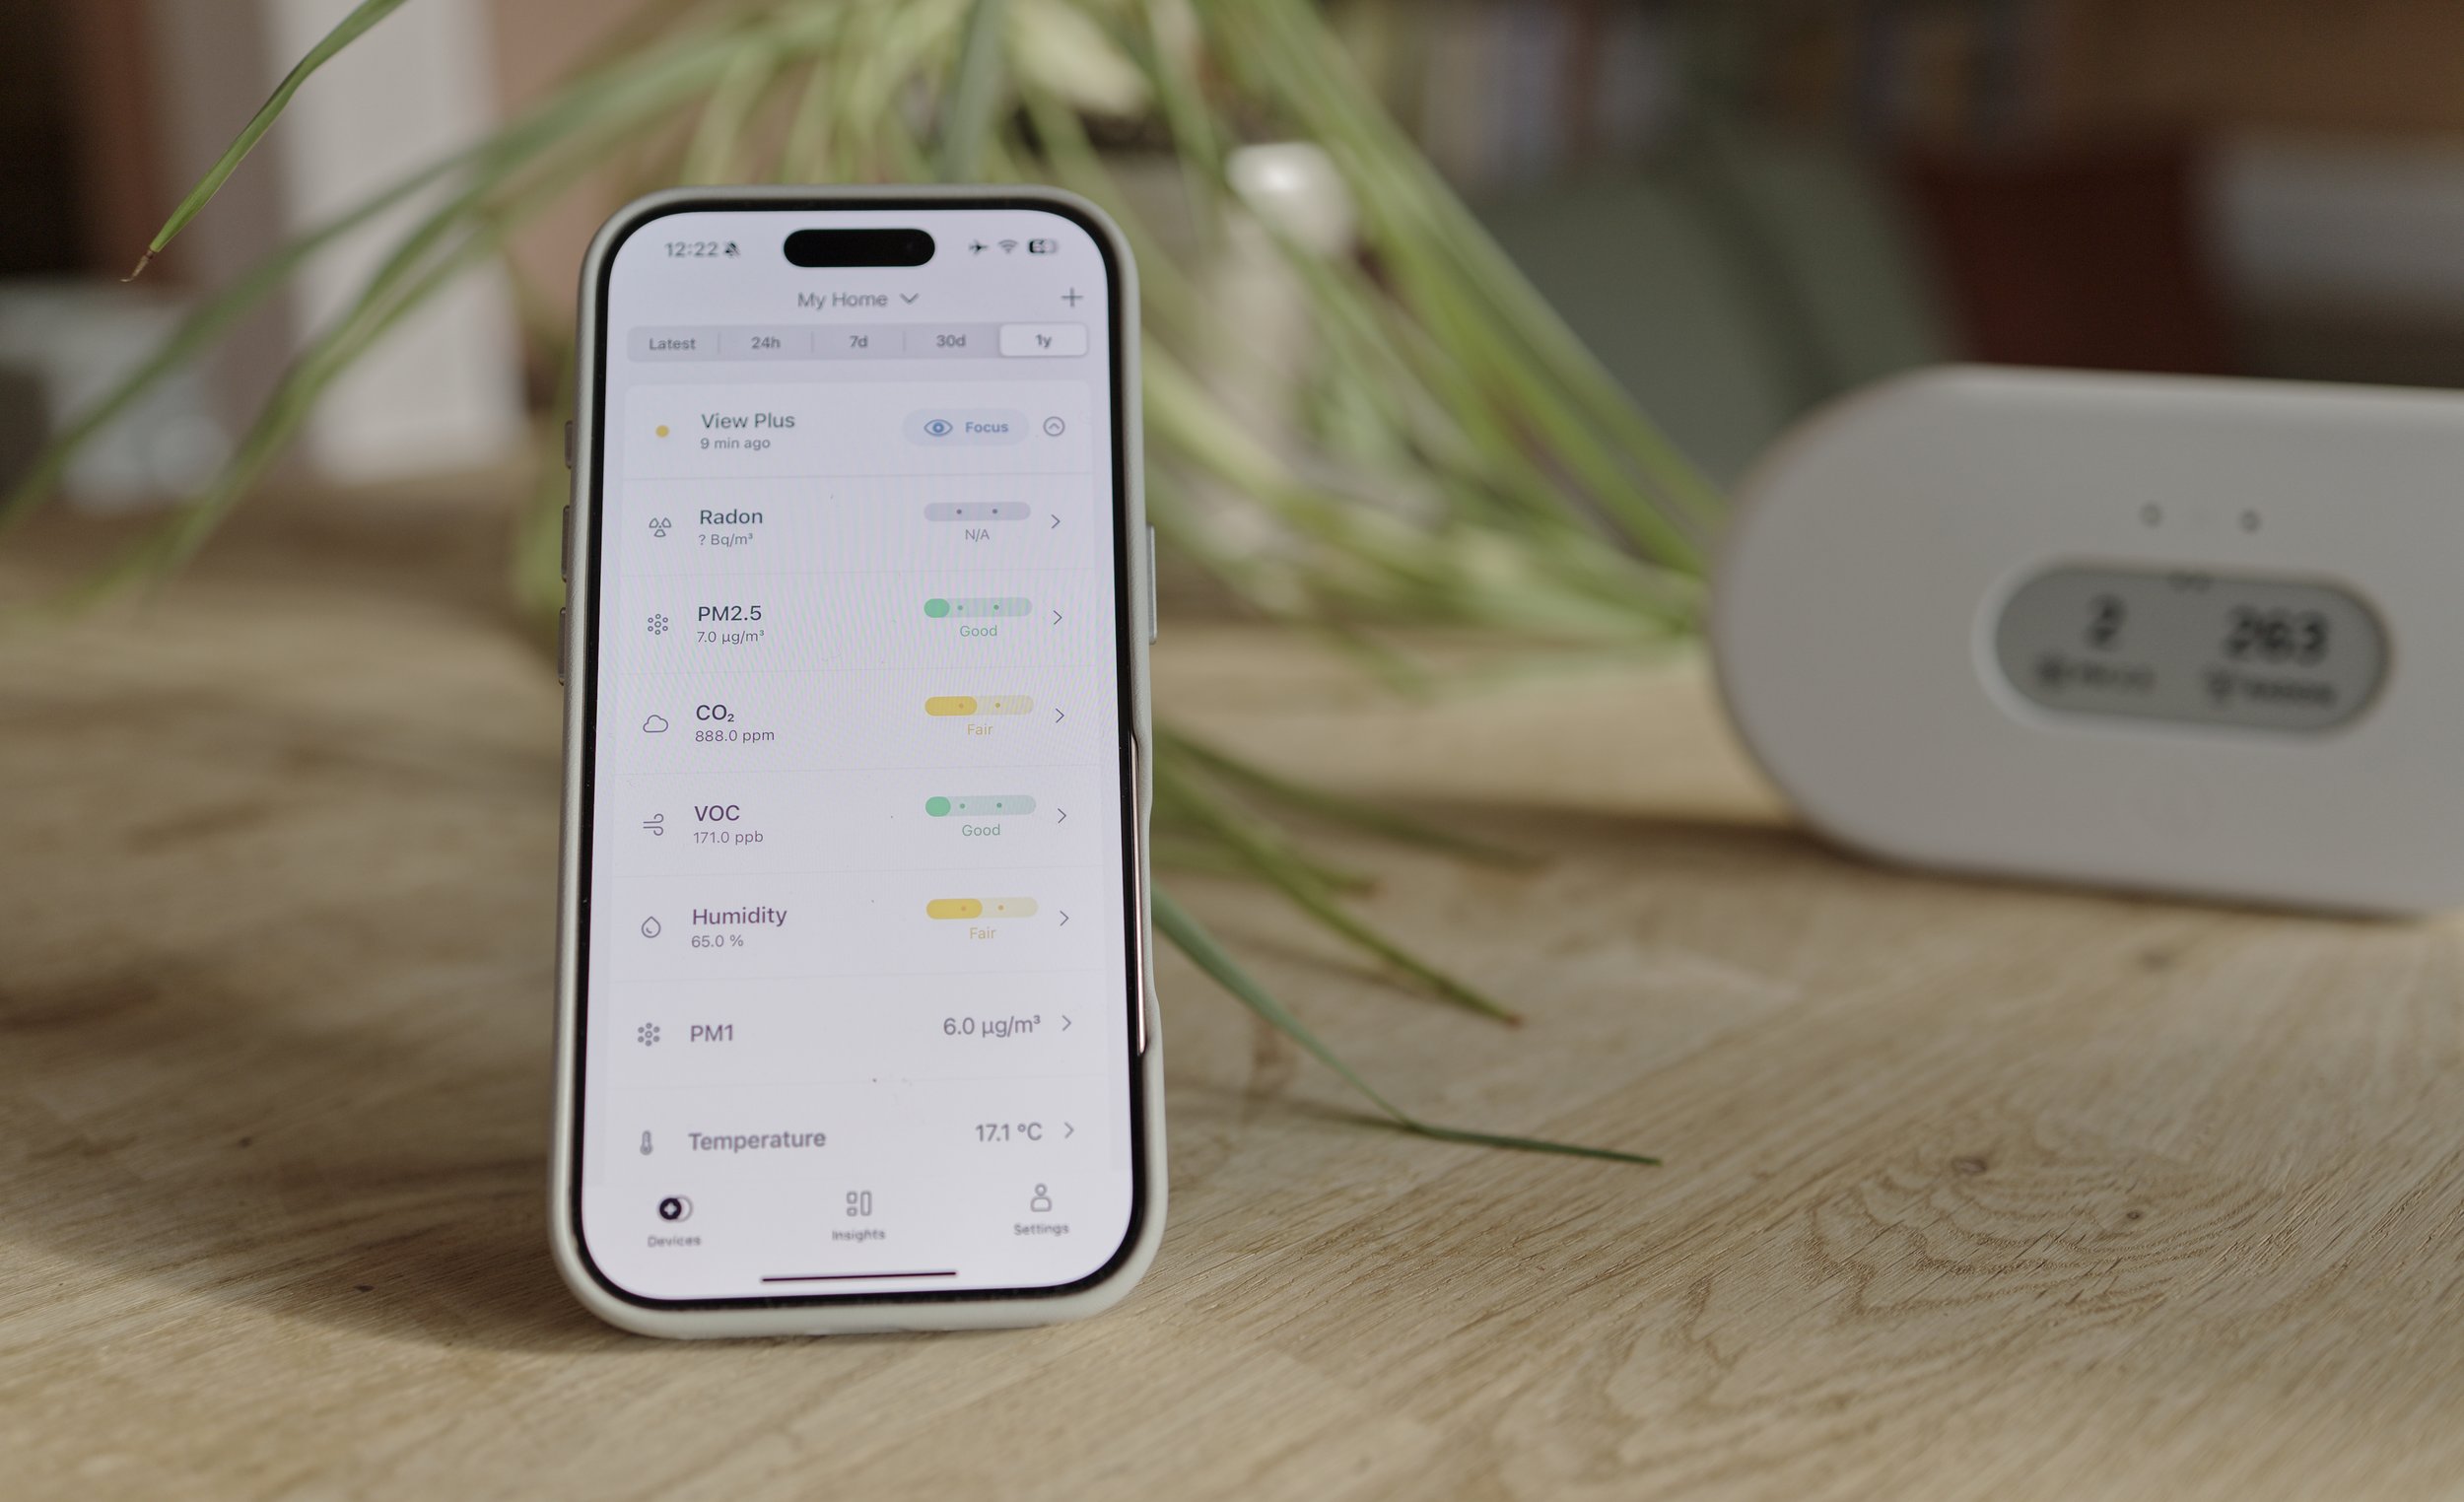
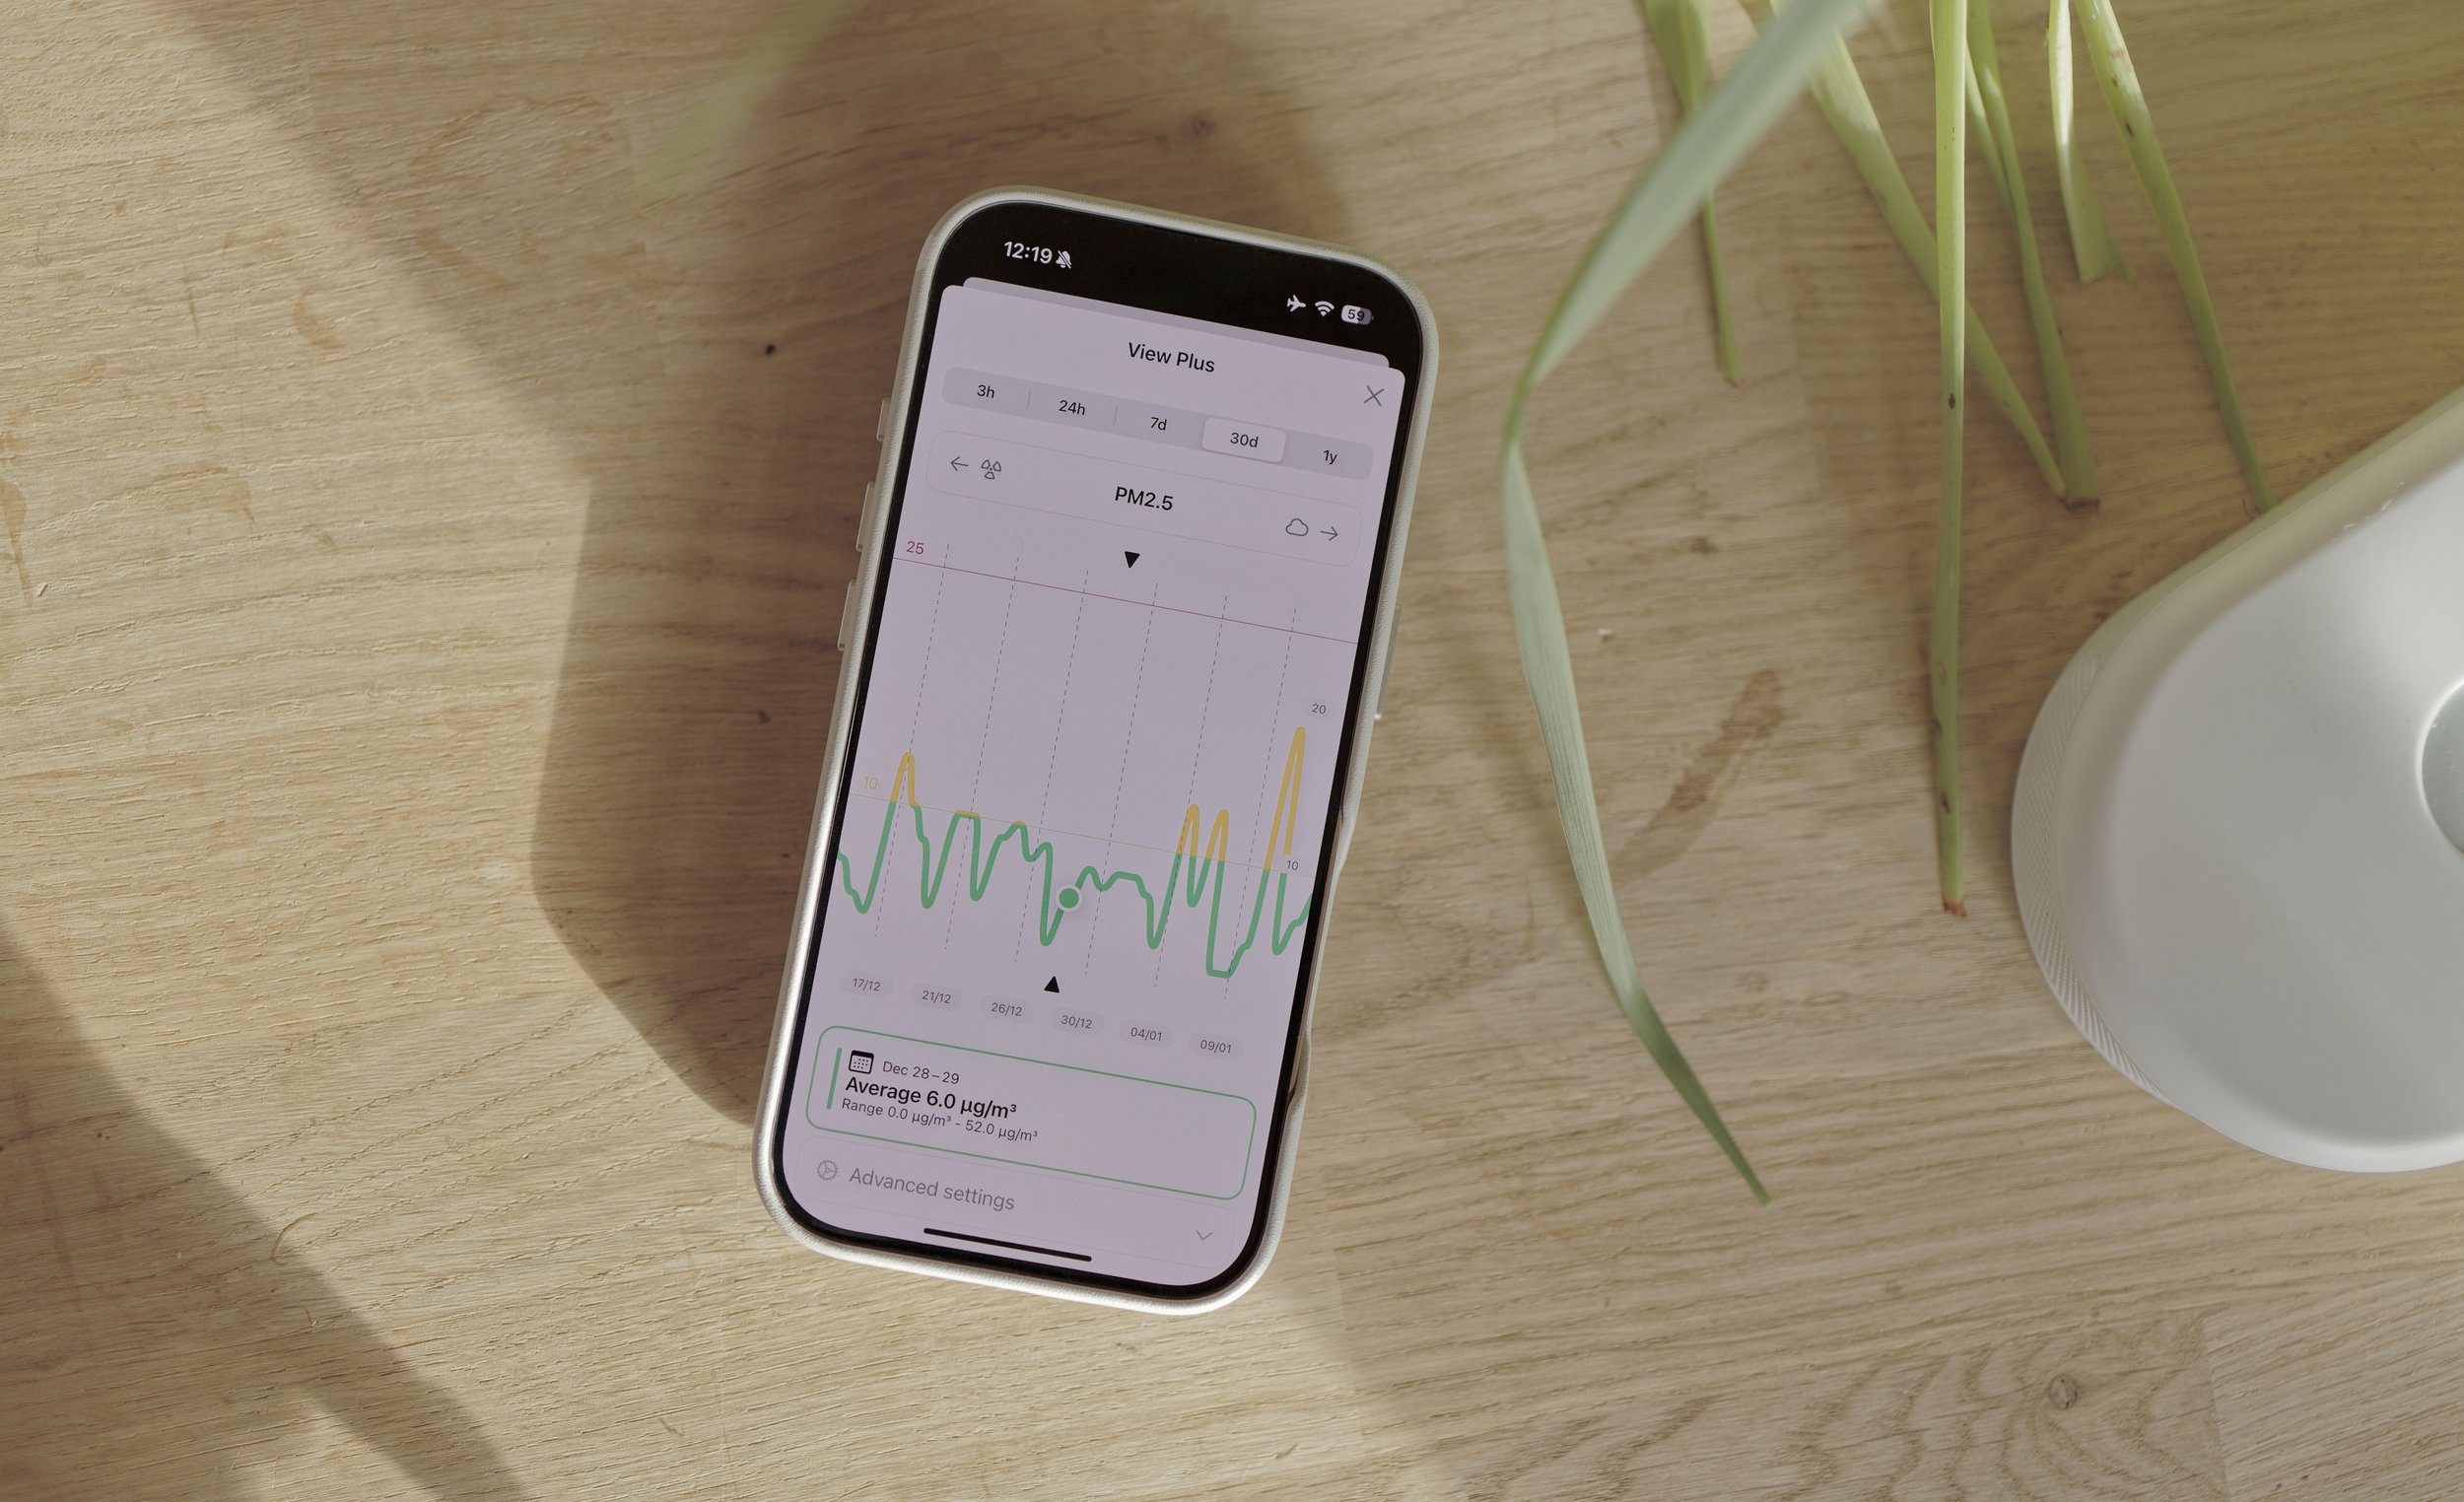
Within the app, you are presented with a scrollable list of air quality metrics measured across the latest 24h, 7d, 30d or 1y period. You can click on any of these data points to zoom into the bigger picture and see specific items across the same time periods. This chart plots if the level is good in green, something to keep in mind when it goes past amber, or enters the red zone, which is when that particular air quality attribute could be negatively affecting your health. We generally like the app usability, but it would be nice if you could see multiple data points on one graph instead of having to click in and out of each one individually.
Living with it; some unexpected readings…
It’s been an education to monitor the diversity in data points within our air quality, from radon, PM2.5, CO2, VOC, humidity, PM1 temperature and pressure. This then allows us to understand the relationship these things have with us and ascertain the reason why levels spike and dip. For instance, from reviewing the trends with the app, we know that all our particulate levels in general are very low, whereas our CO2 is stubbornly just above amber in our granite cottage but not in another building; that being our timber studio. However, it can be in the green zone for both when humidity levels are lower, and, as of the past few weeks, humidity levels have been tropical at over 85%. It’s fascinating to see these interactions between weather events and time of day, or when more road traffic translates into higher particulate air quality readings.
You begin to get a feel for how particulate levels, even in rural areas like ours, spike from outdoor events, but also indoor ones too. We had expected our wood-burning stove to demonstrate high levels of particulates, but when it was burning, PM2.5 levels were 8.0µg/m³ (perfectly healthy) and PM1 ranging from 13-5µg/m³, which is also good. VOC levels can go towards 300ppb at peak when we remove the fire guard for more heat, and settle at an average of 175ppb from a mixture of the guard off and on (also perfectly safe). This data was rather reassuring, but we were surprised to see one thing happen every day in the data, which was the Airthings View Plus showing that the highest particulate level from our wood-burner occurs when it’s first lit. We would never have known, and have now discovered that a way to combat this is to leave the doors closed a little longer during the ignition period.
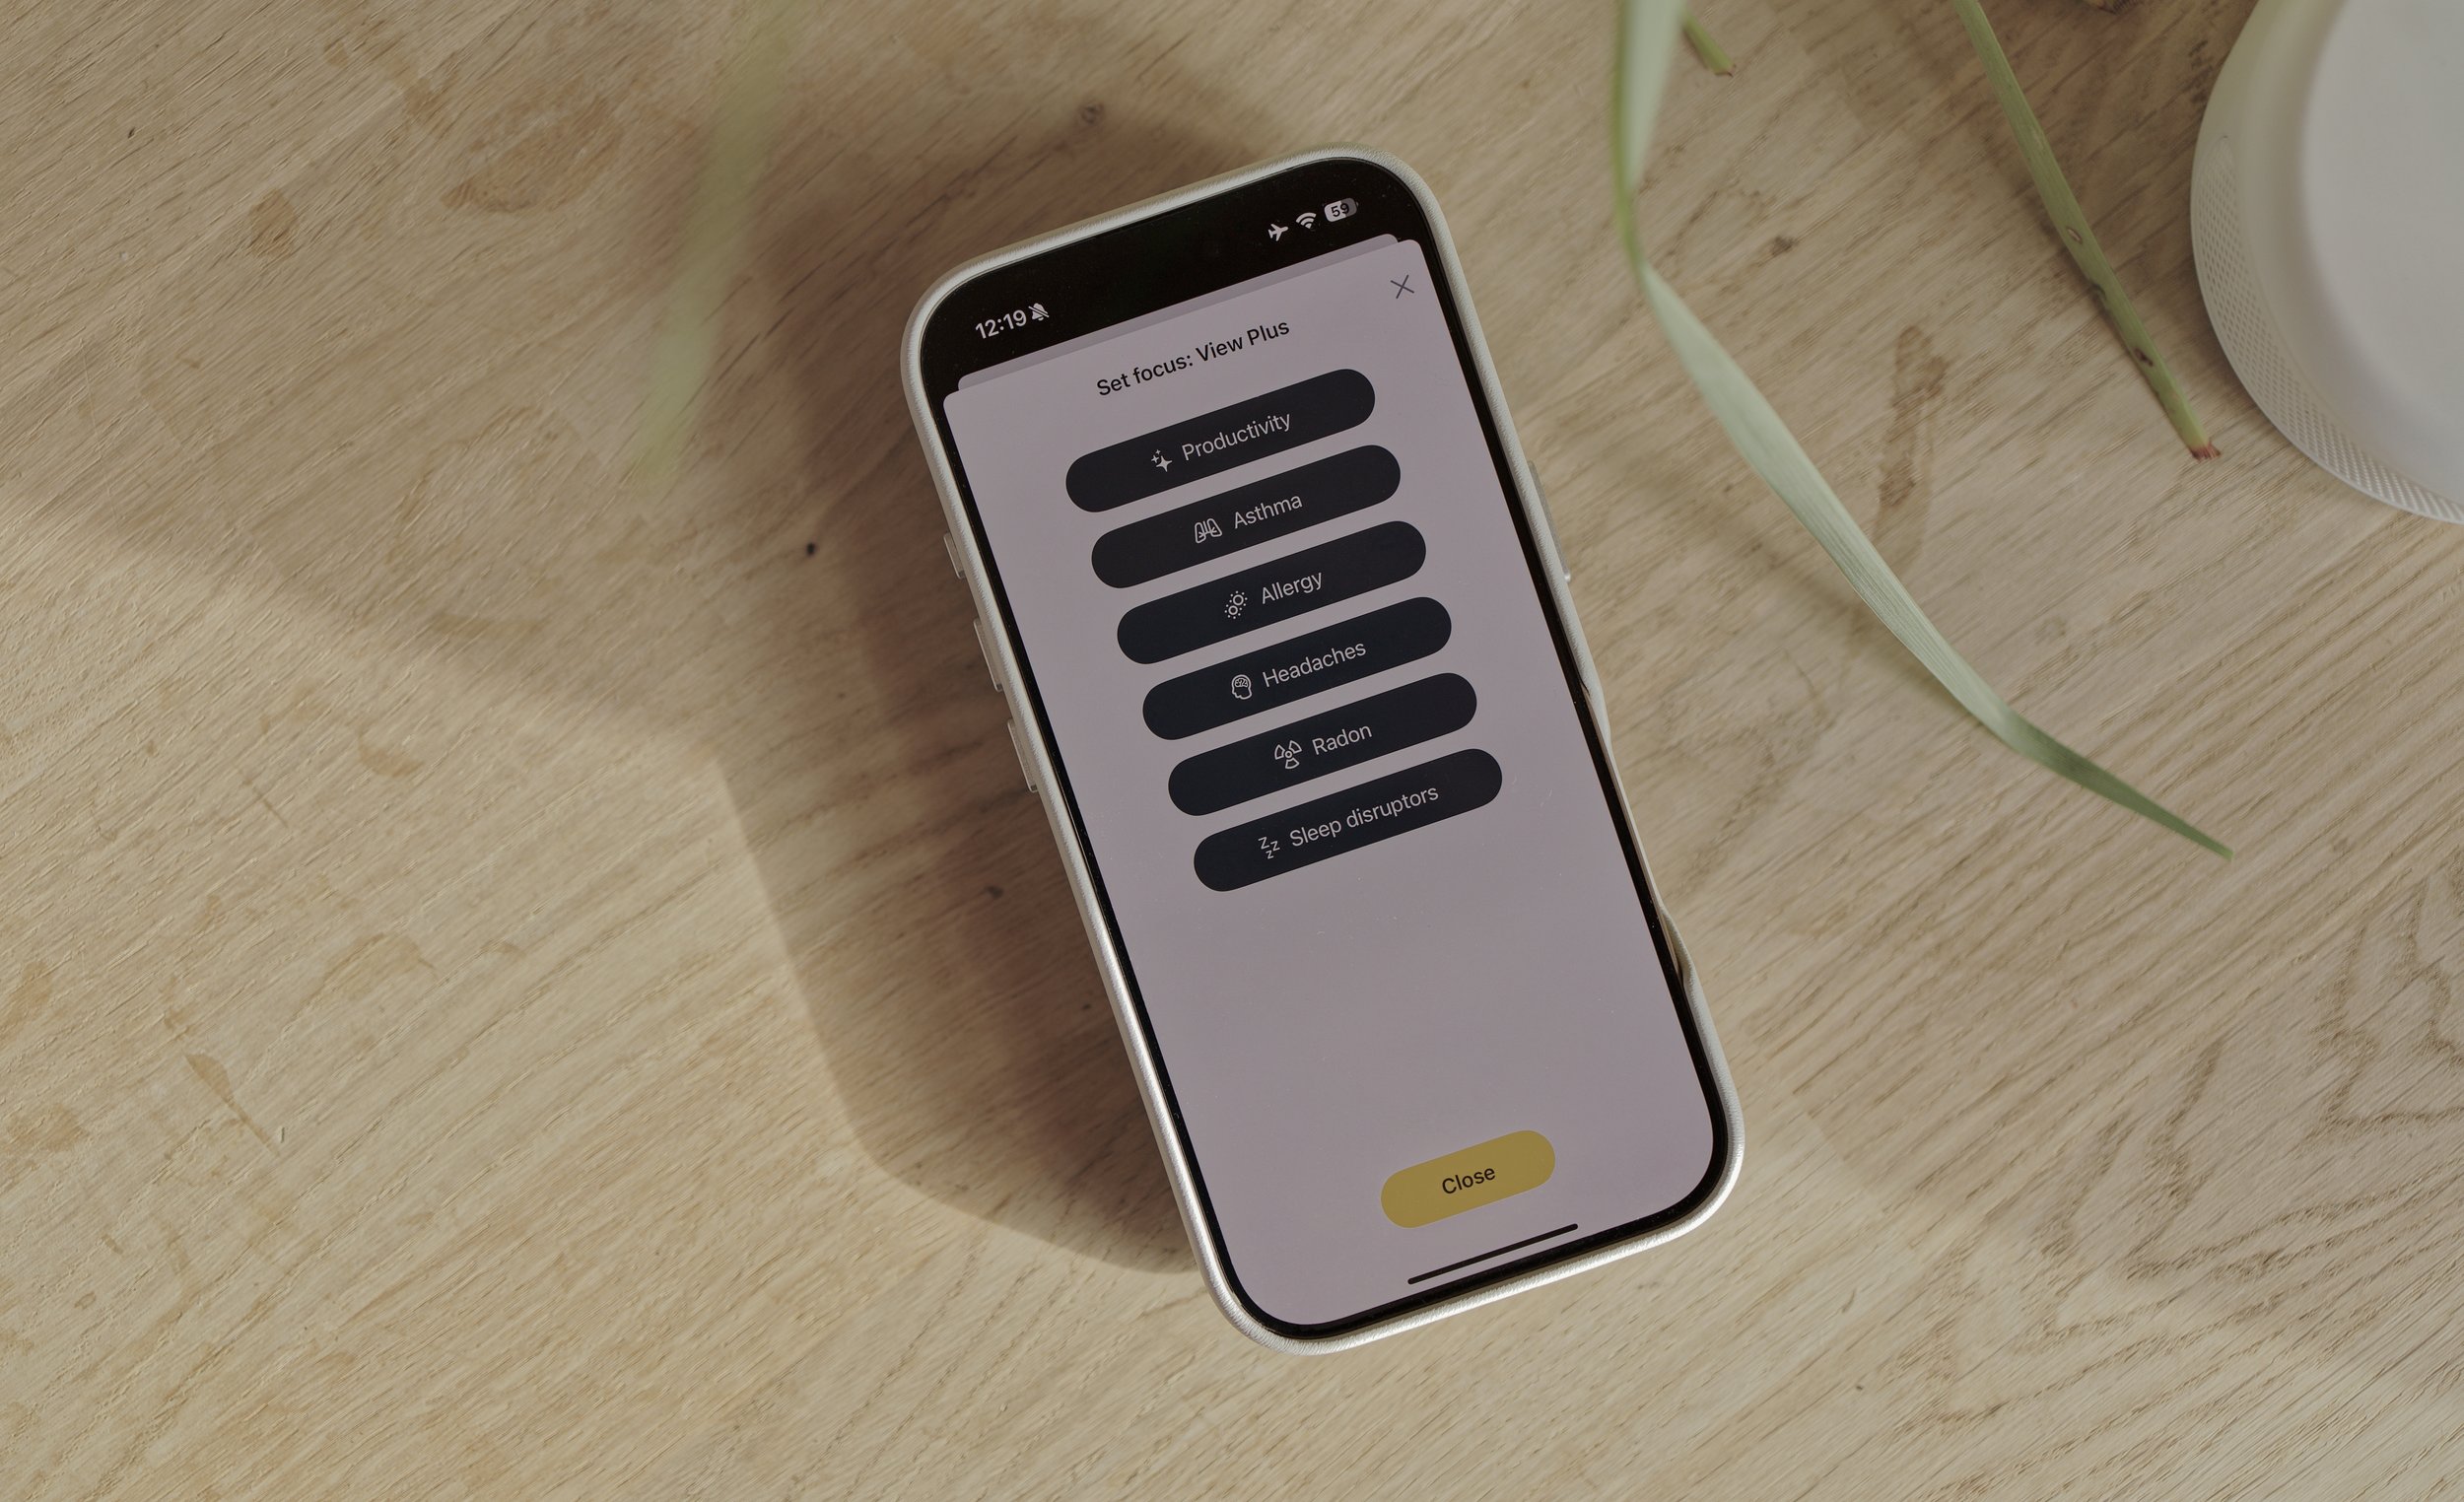
On a really practical level, the Airthings app focuses on how specific air qualities can interact within your environments to impact factors like asthma and allergies, as well as sleep disruptors and headaches. However, what really caught our attention was the productivity overview, which combines the measurements of CO2 and PM2.5 levels. High readings of either one contribute to brain performance impairment. Notably, the ability to think clearly becomes impaired when CO2 levels are higher. For instance, if working in our kitchen, where an oil-burning AGA is present, there’s a notable increase in CO2 levels as shown by the Airthings View Plus. In fact, even before having the Airthings, we always noticed an amount of lethargy from sitting in this environment for long periods and a slower pace of productivity because of it, and now this explains why. However, when we left the Airthings View Plus in a timber studio building, it showed low levels of CO2 and a non-existent amount of PM2.5 particulates. Interestingly, before having this device, within this space lots of people had already noted that they felt more productive and clear-minded. Of course, things like interior aesthetics and desk setups play a role too, but the air we breathe definitely has a major contributory factor on our productivity, and being able to understand this is hugely important for best performance and mental well-being.
We also learnt that sweeping up dust is rarely ever a good idea; you should always dust using a brush head tool on a vacuum cleaner, as the air quality particulate levels spike into amber and red zones when manual brushing takes place; these are the highest readings we’ve ever captured. Our house is a granite cottage built on foundations that contain naturally occurring granite, and we suspected there would be a radon reading level, but were shocked to initially see this peak at over 1000! This is not a safe level to breathe in, but as Airthings note, you should not panic but leave the View Plus to monitor your indoor environmental air quality for around 30 days, so we left it and retrieved an average number of 164, which is within safe limits.
Again, this level is affected by wind, atmospheric pressure, temperature and humidity. For example, low wind speeds and high pressure can trap radon closer to the ground or inside buildings, potentially leading to higher concentrations. Temperature variations, especially in colder months, can increase indoor radon levels as homes are sealed up, reducing ventilation. High humidity and soil moisture can also impact radon emissions, as waterlogged ground may slow its release. As a result, radon levels can fluctuate throughout the week due to these weather conditions, but finding an average that remains well within safe limits is reassuring to know.
Verdict
One of the biggest takeaways from using the Airthings View Plus across different interior spaces was that we can evaluate how and why air can tangibly affect our mental clarity and pace of work. Yes, the initial readings, like our shocking radon peak, may cause alarm, but the device’s ability to provide long-term averages and actionable insights straight to the app quickly reassures.
What stands out most is the educational value the Airthings View Plus brings from an umbrella of sensors to monitor. It’s not just about identifying air quality issues, but understanding the factors behind them, like how humidity affects CO2 levels or why particulates spike during certain activities. This empowers users to make meaningful changes, from improving ventilation to adjusting daily habits, and even rethinking the environments in which they work and live. For anyone curious about what they’re breathing—and how it’s impacting them—the Airthings View Plus delivers on its promise of being both user-friendly and accurate.


